¶ Introduction
Wind is the movement of the air. Since the air is moving, it creates a force, in the direction of the wind flow. For aviation, the wind can exercise a crucial factor on every flight, considering flight performance. For example, a flight with headwind will demand more fuel to reach the destination.
In order to make a better performance planning for your flight, it's possible to predict the wind speed and direction during the flight path by looking at the en-route wind and temperature charts.
¶ The Wind and Temperature Chart
Basically, the Wind and Temperature Chart is a map of a region of the world that shows, in a general view, the forecast of the direction and intensity of the wind and the temperature in a given altitude.
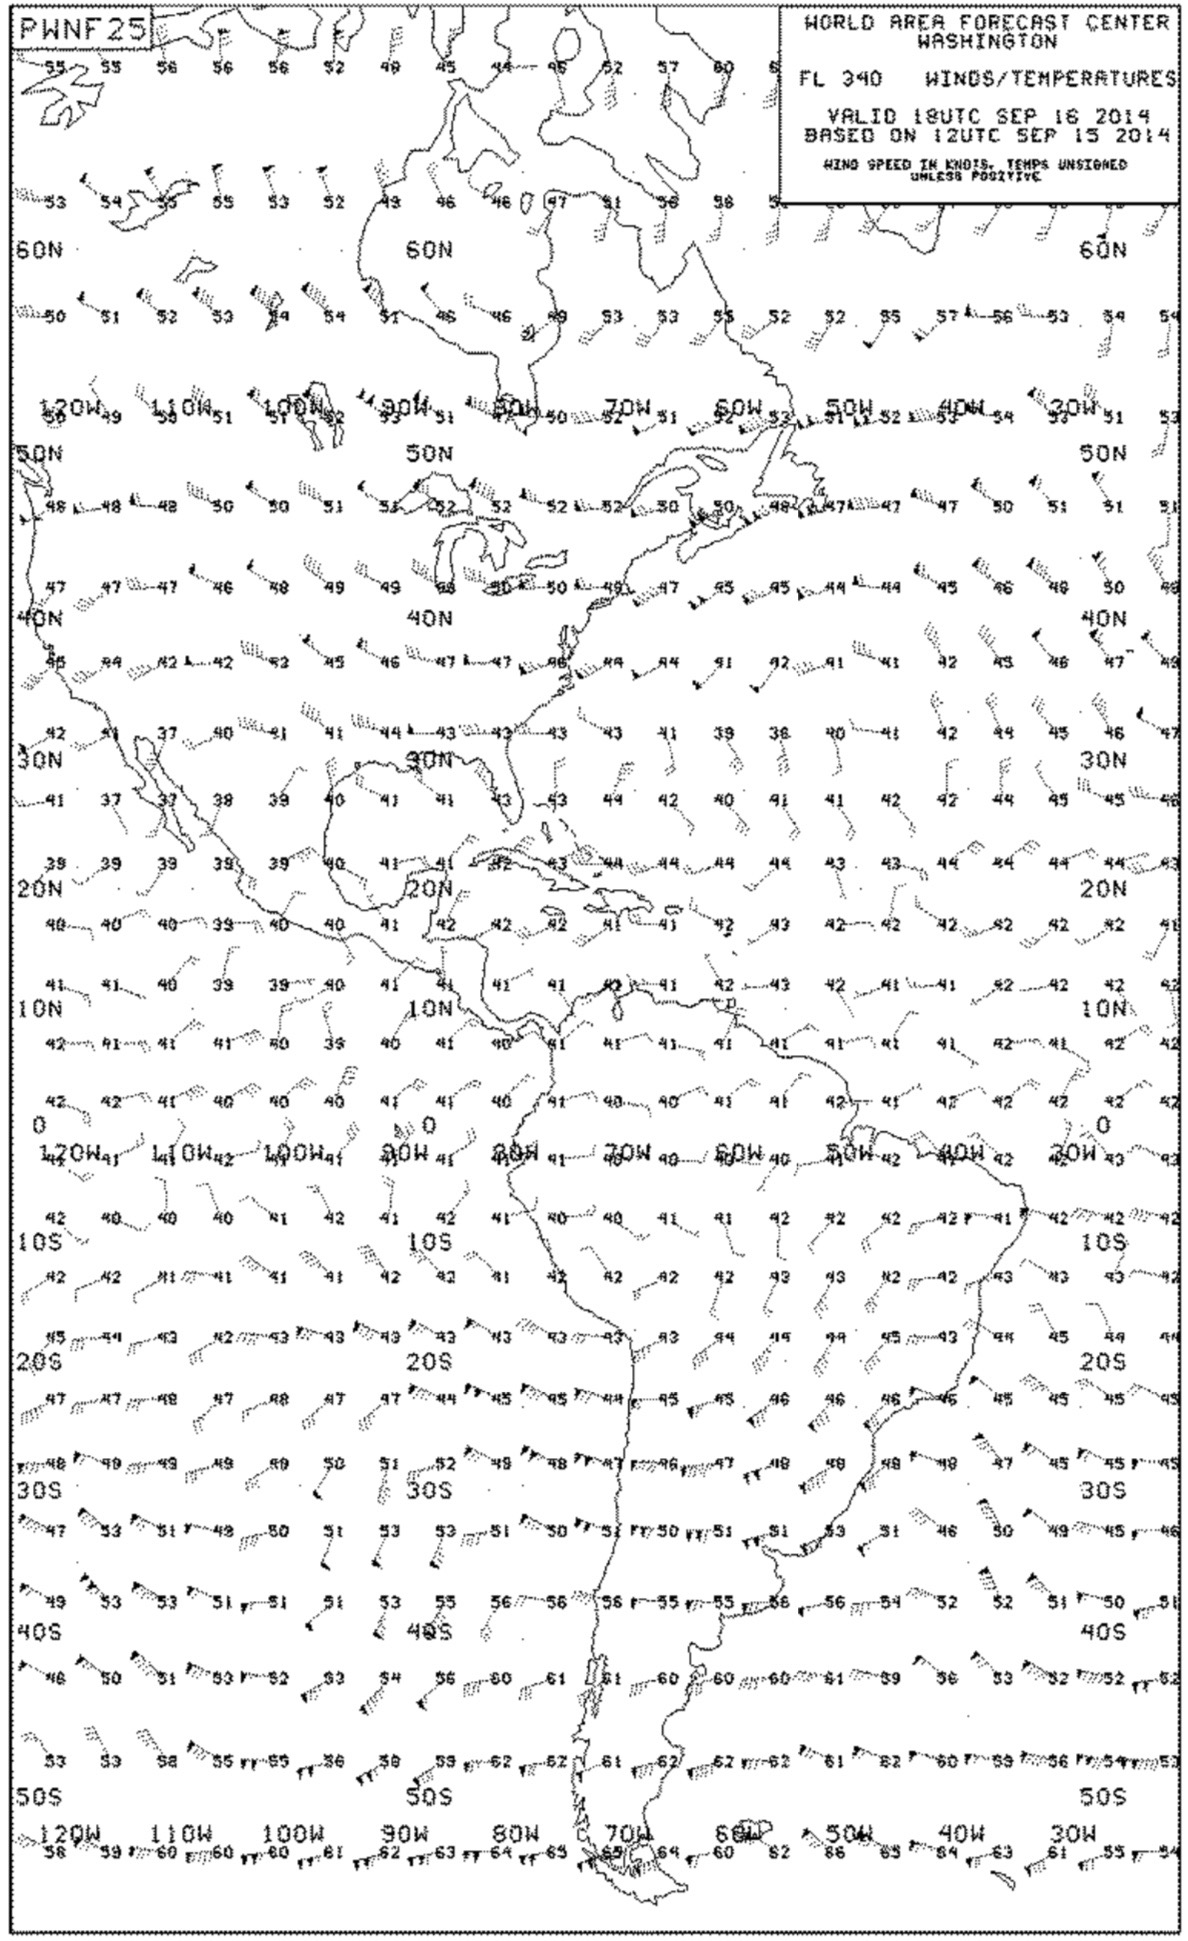
In this map, you can see the information shown in such a chart. This map is valid for the Americas and forecasts Wind and Temperature in the FL340 from 1800Z of September 16th. The information from WAFC (World Area Forecast Center) Washington was compiled at 1200Z of September 15th.
The information above was retrieved from the little box on top right of the map:
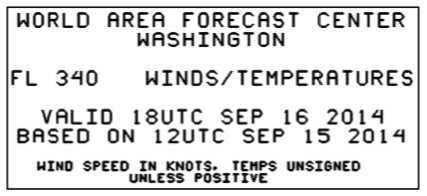
Note that the Wind and Temperature Chart is a forecast, not an observation of current wind and temperature data!
¶ Where can I find these charts?
One of the most stable sources is the WAFS (http://weather.noaa.gov/fax/wafsfax.shtml) which contains these charts covering the entire world with a prognostic up to 36hs from the last update time.
When you open the website, under Winds/Temperatures, you may choose one of two projections available for map drawing: Polar Stereographic and Mercator.
Polar Stereographic projection covers:
- Europe & Atlantic (5000 ft -- 63000 ft);
- North America & Pacific (5000 ft -- 63000 ft);
- South Hemisphere [Pacific] (18000 ft -- 63000 ft);
And Mercator projection covers:
- North & South America (5000 ft -- 39000 ft);
- Atlantic (5000 ft -- 63000 ft);
- Pacific (5000 ft -- 63000 ft).
After choosing the projection and flight level, make sure you're opening the correct chart for the wanted forecast.
You may find other sources of this information, but all of them will follow the same standard.
¶ How to interpret?
¶ Wind Barbs
Basically, the wind barbs give us two elements of information about the wind: direction and speed.
The thin edge of the barb is the direction, while the barbs themselves inform us on the average speed of the wind. They follow the legend below:
¶ Speed
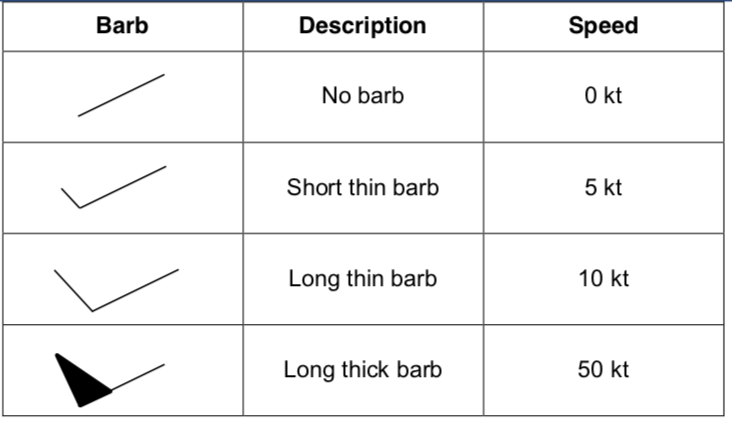
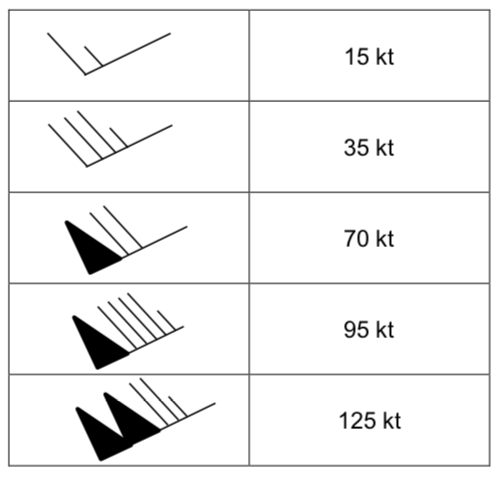
You can have two or more barbs to compose the actual wind speed. For example, a barb indicating 40knots would have four long thin barbs, being like:

You can also combine short or long thin barbs or even thick barbs to compose the speed. Some examples given:
¶ Direction
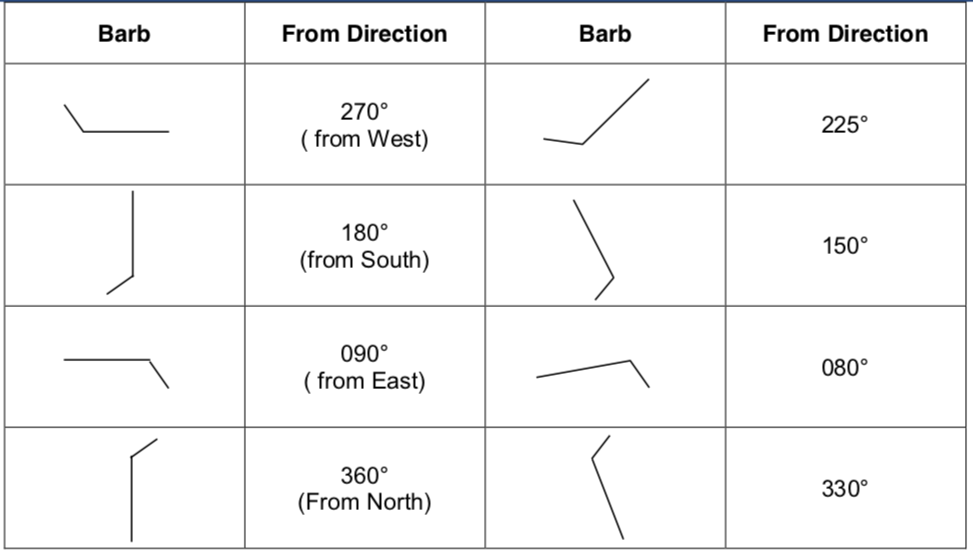
¶ Figures
The figures shown in the chart actually express the forecasted temperature at that point and altitude. Numbers are expressed in negative degrees Celsius.
When a positive degree needs to be informed, it will be preceded by the plus sign (+). So, in the chart, 42 means -42°C, while +6 means +6°C, for example.
¶ Examples
Look at one excerpt of the chart shown in the first page:
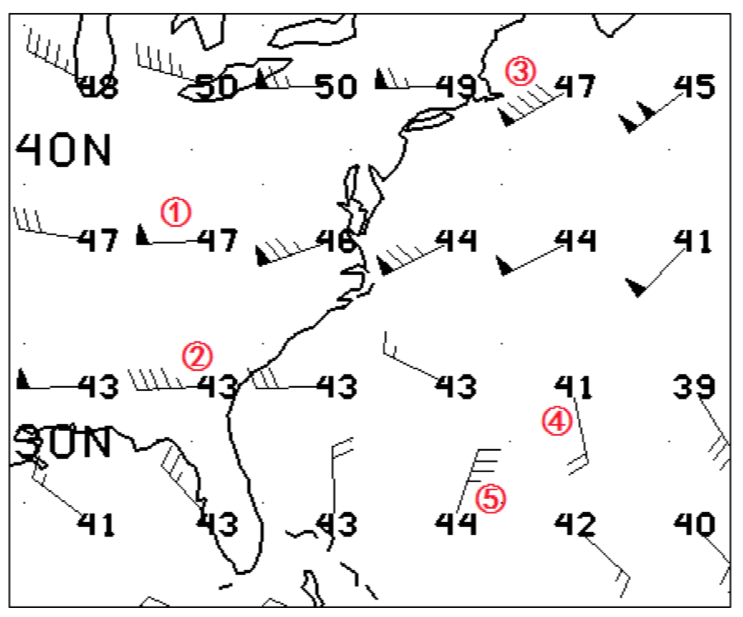
The barb 1 indicates a wind blowing to the east direction, approximately, with 50 kt of speed. The forecasted temperature at that point is -47°C.
The barb 2 indicates a wind blowing to the east direction, approximately, with 45 kt of speed. The forecasted temperature at that point is -43°C.
The barb 3 indicates a wind blowing to the northeast direction, approximately, with 90 kt of speed. The forecasted temperature at that point is -47°C.
The barb 4 indicates a wind blowing to the north direction, approximately, with 20 kt of speed. The forecasted temperature at that point is -41°C.
The barb 5 indicates a wind blowing to the south direction, approximately, with 35 kt of speed. The forecasted temperature at that point is -44°C.
- None
- ICAO documentation : Annex 3 : Meteorological Service for
International Air Navigation - 20th Edition - July 2018 - Annex I
- VID 150259 - Creation
- VID 450012 - Wiki Integration
- VID 496402 - Wiki.js Integration